LOADING

G3W-SUITE 3.2 – Demo on line

QGIS 3.16 LTRPython 3 Django 2.2

QGIS API integration

Welcome to the G3W-SUITE demo

The demo service is designed to illustrate how it is possible to create a WebGis cartographic management application starting from a simply QGIS project.

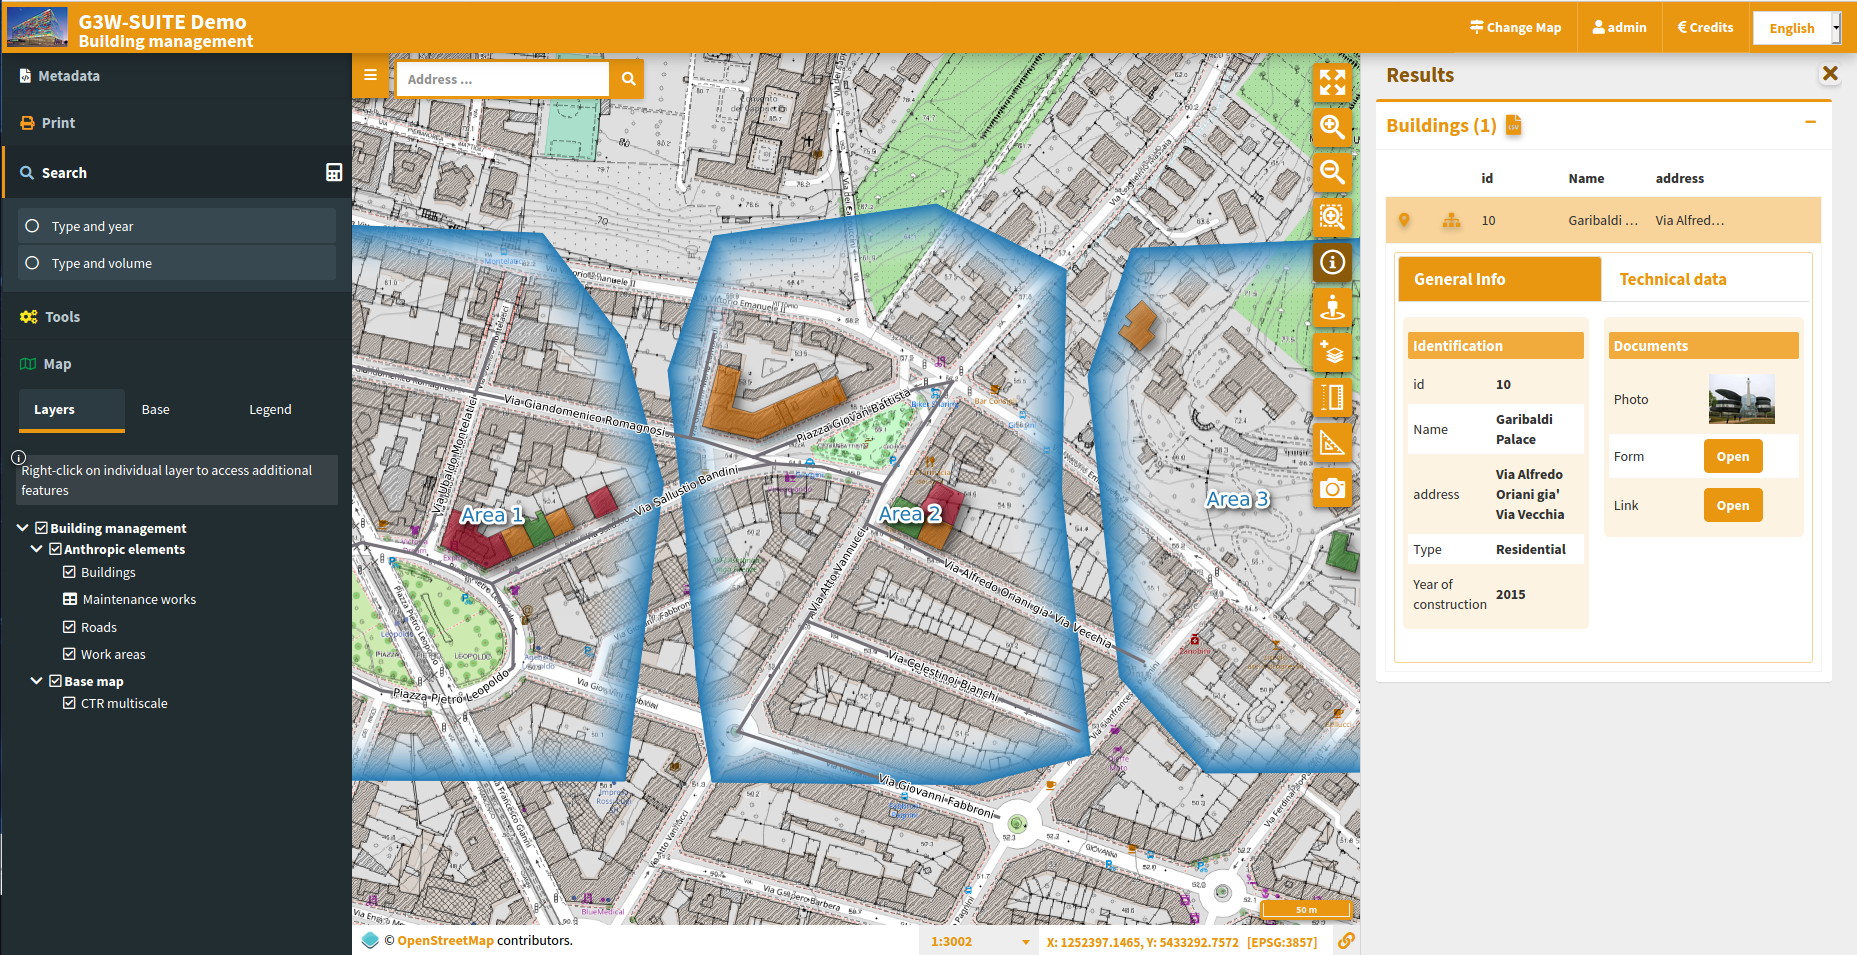
The example demo is dedicated to the management of buildings and associated maintenance interventions.

Access the application, consult the data, carry out searches, view plots made with the DataPlotly plugin and print reports based on geographical atlases.

On line editing

To test the geometric and relational editing features, log in as a demo user with the following credentials:

      • user: viewer1
      • pwd: G3wsuite123

G3W-SUITE allows multi-user editing based on a feature-lock system.

For this reason, some features may not be editable if locked by other users.

Move on the map to edit free features or create new ones!

Download data and QGIS 3.16 LTR project on which the WebGis service is based and discover all the functions and settings inherited automatically:

      • OGC service management
      • AuthCFG authentication system
      • simbology with the management of multi-styles
      • join and 1:n relations
      • consultation and editing attributes form structure
      • attributes editing widgets
      • mandatory and unique constraints
      • plots created with DataPlotly QGIS plugin
      • standard print layout
      • prints based on geographical atlases

Do you want to customize the QGIS project and publish your web cartographic management application?

Consult the tutorial, download the demo data and customize the QGIS project.

Log in as administrator user to publish your WebGis service including editing functions.

      • user: demo
      • pwd: G3wsuite123

Do you want test advanced features?

Discover all the features dedicated to the customization of your WebGis services.

Create geographic and alphanumeric constraints for the aspects of editing and visualization using SQL language or QGIS expressions and associate them with the user viewer1.

Create reports for web printing, upload xml plots created on QGIS with the DataPlotly plugin and much more …